Small to Medium Enterprises
Table of contents
Māori Business
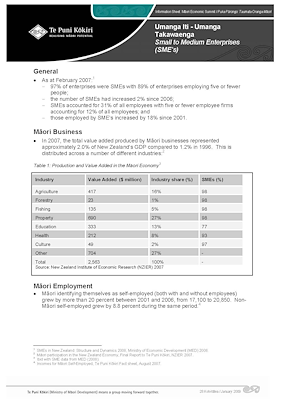
In 2007, the total value added produced by Māori businesses represented approximately 2.0% of New Zealand’s GDP compared to 1.2% in 1996. This is distributed across a number of different industries:2
Table 1: Production and Value Added in the Māori Economy
| Industry | Value Added ($ million) |
Industry share (%) |
SMEs (%) |
|---|---|---|---|
| Agriculture | 417 | 16% | 98 |
| Forestry | 23 | 1% | 98 |
| Fishing | 135 | 5% | 98 |
| Property | 690 | 27% | 98 |
| Education | 333 | 13% | 77 |
| Health | 212 | 8% | 93 |
| Culture | 49 | 2% | 97 |
| Other | 704 | 27% | - |
| Total | 2,563 | 100% | - |
Source: New Zealand Institute of Economic Research (NZIER) 2007
2 Māori participation in the New Zealand Economy, Final Report to Te Puni Kōkiri, NZIER 2007.
3 Ibid with SME data from MED (2008).